
Dynamic Heatmaps: Understand User Behavior with Friction Labs
Numbers Tell a Story - But Not the Whole Story
Imagine you're reviewing your website analytics.
Traffic is increasing.
Your rankings are improving.
Visitors are landing on your product page.
Yet conversions remain disappointing.
Google Analytics shows a bounce rate.
Search Console reports impressions.
Your SEO tool says everything looks healthy.
But none of these platforms answer the one question every marketer eventually asks:
Why aren't visitors converting?
This is where traditional analytics reach their limits.
Metrics explain what happened.
Dynamic Heatmaps explain why it happened.
Instead of looking at rows of numbers, you see how real people interact with your website-where they click, how far they scroll, which elements they ignore, and where they lose interest.
For businesses focused on improving both SEO performance and user experience, this context is invaluable.
What Are Dynamic Heatmaps?
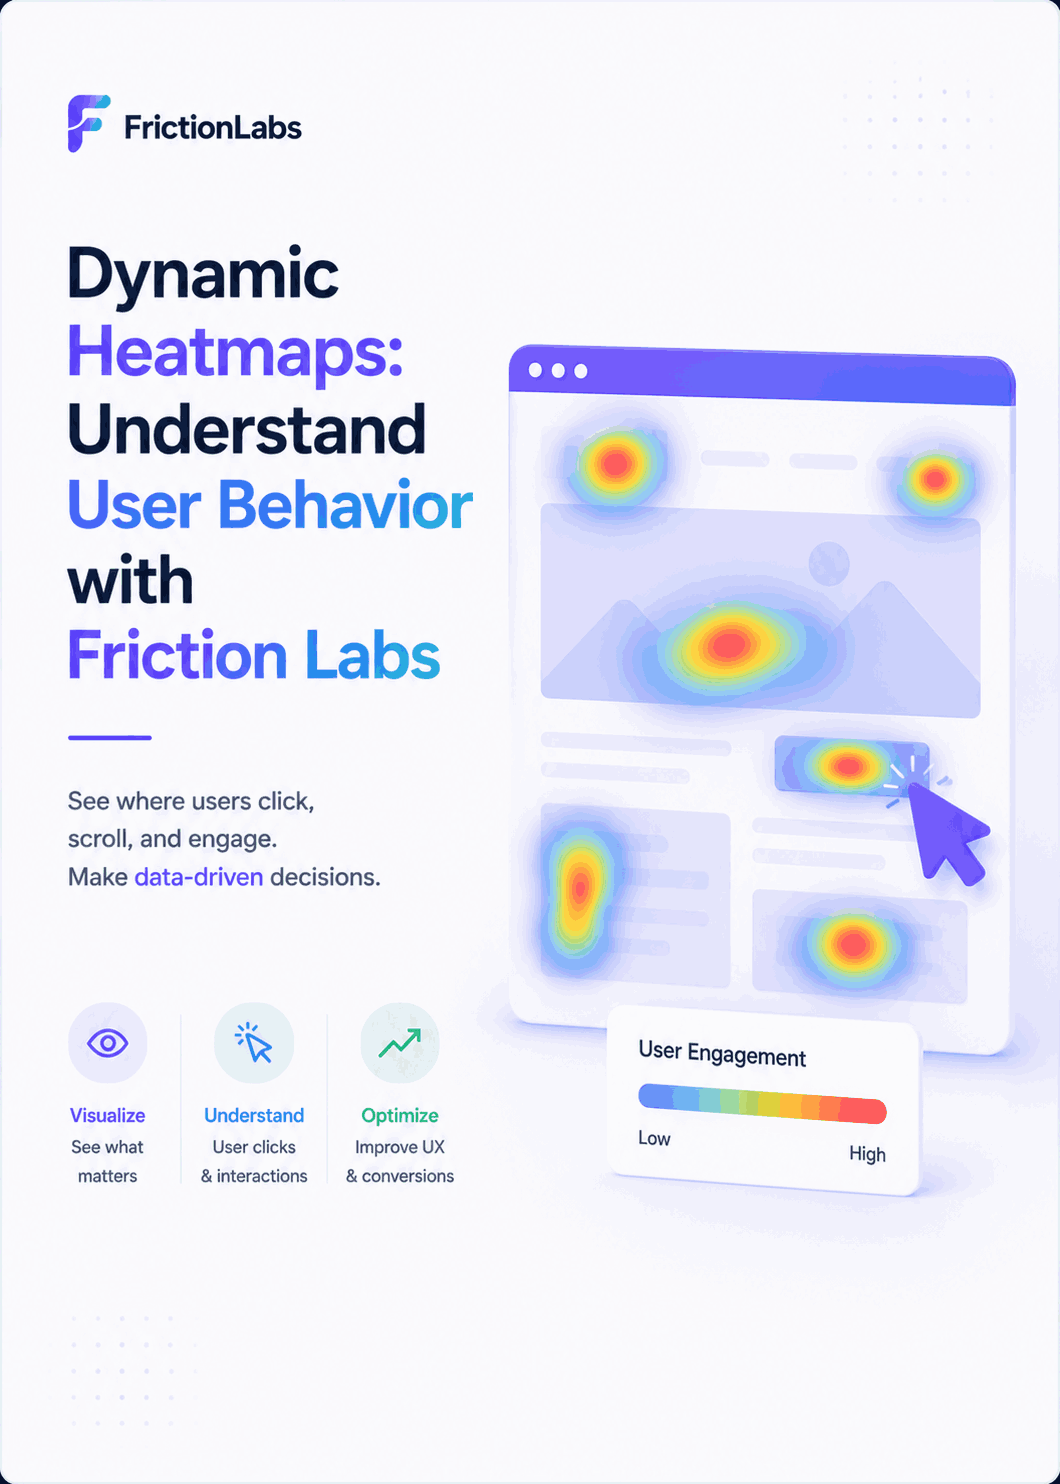
A heatmap is a visual representation of visitor activity on a webpage.
Rather than displaying data in spreadsheets or reports, it overlays user interactions directly onto your website.
Areas with the most activity appear warmer, while sections receiving little attention remain cooler.
Friction Labs' Dynamic Heatmaps go a step further by capturing evolving user behavior across different pages, devices, and sessions, helping teams identify patterns that static reports often miss.
The result is a clearer understanding of how visitors engage with your content.
Why Traditional Analytics Aren't Enough
Analytics platforms provide valuable information, including:
- Page views
- Bounce rates
- Session duration
- Traffic sources
- Conversion numbers
These metrics are useful, but they don't reveal how users behave between arriving on a page and leaving it.
For example:
- Did visitors notice your call-to-action?
- Did they stop scrolling before reaching important content?
- Were they repeatedly clicking an element that wasn't interactive?
- Was a navigation menu difficult to use?
- Did a page layout create confusion?
Without visual behavioral data, answering these questions often involves guesswork.
How Friction Labs' Dynamic Heatmaps Work
Friction Labs records anonymized interaction patterns and transforms them into visual heatmaps that help teams understand how users experience a webpage.
Instead of relying on assumptions, businesses can see exactly how visitors engage with their content.
The platform highlights interaction trends such as:
Click Activity
Discover which buttons, images, menus, and links attract the most attention-and which important elements are being overlooked.
Scroll Depth
Not every visitor reaches the bottom of a page.
Scroll heatmaps reveal where users stop reading, making it easier to reposition key messages, forms, or calls-to-action higher on the page.
Engagement Patterns
Some visitors hesitate before taking action.
Dynamic Heatmaps reveal areas where users pause, repeatedly interact, or become distracted, helping identify friction that isn't obvious from traditional analytics.
Device-Based Behavior
Visitors often behave differently on desktop, tablet, and mobile devices.
By comparing engagement across screen sizes, teams can uncover usability issues that affect only certain audiences.
Finding Hidden Conversion Barriers
Many conversion problems aren't caused by poor products or weak marketing campaigns.
They're caused by small usability issues.
Examples include:
- Important buttons placed too low on the page
- Confusing navigation
- Poor visual hierarchy
- Overcrowded layouts
- Misleading design elements
- Long forms
- Slow-loading sections
- Distracting pop-ups
These problems may seem minor individually, but together they create friction that discourages users from completing their journey.
Dynamic Heatmaps make these barriers visible.
How Heatmaps Support SEO
Heatmaps don't directly influence search rankings.
However, they improve many of the user experience signals that contribute to long-term SEO success.
When visitors engage more effectively with your content, they're more likely to:
- Stay on the page longer
- Explore additional content
- Complete conversions
- Return in the future
- Share useful resources
Improving user experience also reduces the need for constant redesigns based on assumptions rather than evidence.
Heatmaps and AI-Powered Search
The future of search extends beyond ranking positions.
Google AI Overviews, conversational search platforms, and large language models increasingly prioritise content that provides genuine value and satisfies user intent.
Behavioral insights help businesses create content that's easier to navigate, more engaging to read, and better aligned with user expectations.
When visitors consistently find answers, interact naturally, and complete meaningful actions, it reinforces the overall quality of a website.
While AI systems don't read heatmaps directly, improving user experience strengthens the technical and content signals that support visibility across both traditional and AI-powered search.
Combining Heatmaps with Session Replays
A heatmap shows patterns.
A session replay tells the story behind those patterns.
For example, a heatmap might reveal that many users stop scrolling halfway through a pricing page.
A session replay can explain why.
Perhaps visitors struggle with a comparison table.
Maybe they hesitate over a form.
Or perhaps a mobile navigation issue interrupts the journey.
Together, these tools provide a much richer understanding of visitor behavior than either one alone.
This integrated approach is one of Friction Labs' biggest advantages.
Practical Ways Businesses Use Dynamic Heatmaps
Businesses across industries use heatmaps to improve digital experiences.
Common applications include:
Landing Page Optimisation
Ensure visitors notice key messaging and calls-to-action.
E-commerce
Understand how shoppers interact with product pages before making a purchase.
SaaS Platforms
Identify friction during free trial sign-ups or onboarding flows.
Lead Generation
Improve enquiry forms by reducing unnecessary complexity.
Content Marketing
Discover whether readers engage with important sections of long-form articles.
Why Visual Analytics Matters
Modern websites generate enormous amounts of data.
The challenge isn't collecting more information-it's making sense of it.
Dynamic Heatmaps simplify decision-making by turning behavioral data into visual insights that anyone can understand.
Rather than debating why conversions declined, teams can review actual visitor interactions and make evidence-based improvements.
Why Friction Labs Takes a Different Approach
Many heatmap tools focus only on user clicks.
Friction Labs integrates behavioral analytics into a broader website intelligence platform.
Alongside Dynamic Heatmaps, businesses gain access to:
- Automated Technical SEO Audits
- Core Web Vitals Monitoring
- AI Site Analyzer
- Session Replays
- Rank Radar
- Automated Signals
- Audience Finder
This combination helps organisations connect technical health, search performance, and user behavior in one workflow instead of switching between multiple platforms.
Frequently Asked Questions
What is a Dynamic Heatmap?
A Dynamic Heatmap is a visual analytics tool that shows where users click, scroll, and interact on a webpage, helping businesses understand visitor behavior and identify usability issues.
How are Dynamic Heatmaps different from Google Analytics?
Google Analytics provides numerical data such as page views and bounce rates. Dynamic Heatmaps visually display user interactions, making it easier to understand why visitors behave the way they do.
Do Heatmaps improve SEO?
Heatmaps don't directly affect rankings, but they help improve user experience, engagement, and conversion paths, which support stronger overall website performance.
How does Friction Labs use Dynamic Heatmaps?
Friction Labs combines Dynamic Heatmaps with Session Replays, Technical SEO Audits, and Core Web Vitals Monitoring to provide a comprehensive view of website health, user behavior, and conversion optimization.